Streamlining Historical Map Digitisation: Implementing a Progress Tracking Grid System in QGIS
Introduction
Creating vector data based on historical raster maps can be a complex task, especially when working with large raster images and expecting to extract large amounts of vector features. During manual creation of vector features a common challenge is tracking the progress of the digitisation work. Without a clear system to monitor which areas of the raster map have been completely digitised, you can find yourself rescanning the map from time to time to ensure that everything has been really done. This is a multiplication of efforts.
To address this issue, we can create a way to visually track and manage progress across the entire map. Our solution involves implementing a grid overlay system in QGIS, which allows us to break down the raster map into manageable sections. By assigning colours to these sections based on their completion status, we can easily identify which parts have been digitised and which remain to be worked on. This approach reduces redundancy, streamlines the overall workflow and enhances team coordination.
Work process
The essence of the process is to create a grid layer that breaks down the large area into smaller that can then be coloured, indicating the status of each rectangle area - are they complete or note? A grid must be created for each output layer, e.g. If you are vectorising house locations as points and roads as linestrings, then we need two layers.
The creation and work with a progress tracking grid involved the following steps.
We assume the QGis digitisation project is open and includes raster layers and vector layers that are being created.
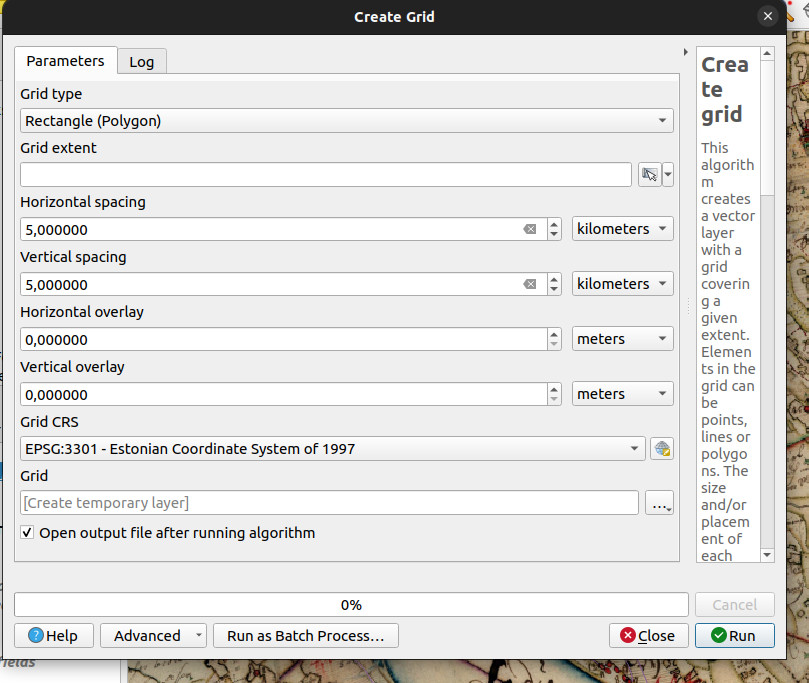
Navigate to Vector > Research Tools > Create Grid. Define the grid parameters, such as size and extent, based on your project needs. For example you can derive grid extent from the underlying raster by clicking on an icon beside the grid area and selecting "Calculate from Layer". For horizontal or vertical spacing, you would need to set values based on your data, for example, 5 km. Then, select output layers, such as a GeoPackage file, and let it be opened automatically in the system.

Adding Status Tracking: Open the Attribute Table for your grid layer and enter editing mode. Add a new field named tracking_status to track the completion status of each grid cell. It might be sufficient for your cells to be categorised just as strings NULL (e.g. no need to add content) and "DONE"
Applying Styles and Color-Coding. First, go to
Customise the grid appearance by going to Properties > Symbology. Set the symbology to Categorized, and select the tracking_status field as Value. Then assign colours to different status values such as "DONE" and others (you can add a more complex division like "Not started" / "started" / "in progress" / "done" if needed). Do not forget to colour the border and make the background transparent so you will also see the vector data and background map raster, which is needed while checking.Maintaining and Updating. The whole work process should, to some extent, now follow the grid-based logic. While working and having finished a rectangle within the grid (or checking the whole area for work done and finishing a grid), you should change its tracking_status value. For this dot the following:
- enable editing of the layer by selecting the layer and clicking on the "pencil" button.
- Use the Identify Features tool (blue i icon) on the toolbar and enable it by clicking on it.
- Click directly on the grid cell you want to edit on the map.
- The Identify Results panel will open, displaying the attributes of the selected grid cell.
- On the field, right-click opens a form and select "Edit feature form"
- In the feature form, change tracking_status value, e.g. write there: DONE
- After saving, the rectangle, turns green, marking that work with this area is finished.
This provides a basic workflow of spatially tracking your manual vectorisation work in QGis